Manufacturing Dashboards for Actionable Data
In this video, Fulcrum's launch manager, Kelsey Stimson, highlights three interconnected data-rich sections of the Fulcrum platform: the sales order grid, job page, and purchasing planning. Each of these areas have key performance indicators (KPIs) that help you make better decisions in the moment.
Sales Order Grid: Instant Visibility into Shipments and Late Orders
The sales order grid is a central hub for essential information, displaying KPIs prominently at the top of the screen. These KPIs include recent shipment data, late orders, value over time, and filterable statuses like draft and approved. Users can click on any of these windows to filter the information below, making it easy to pinpoint orders that demand attention.
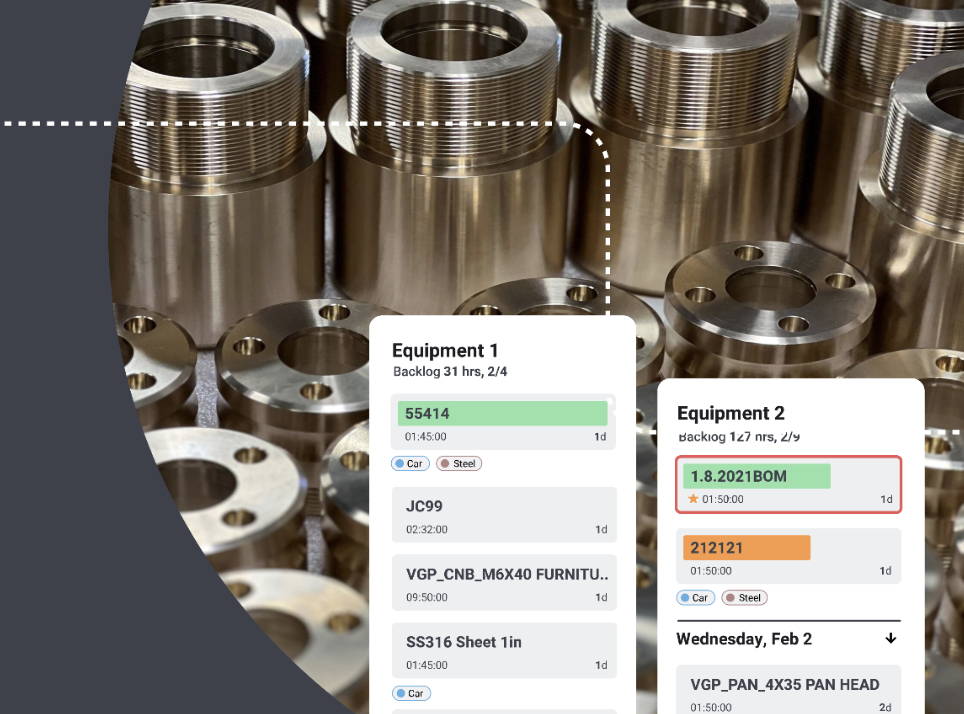
Job Page: Real-Time Labor Data, Material Picking, and Profit Margins
Fulcrum's job page offers up-to-the-minute insights into the shop floor, including real-time labor data, material picking, and profit margins based on initial job estimates. This real-time data eliminates the need for manual updates and inquiries, enabling manufacturers to stay informed about ongoing processes on their shop floor.
Purchasing Planning: Data-Driven Recommendations and Timing Insights
The purchasing planning section of Fulcrum's platform delivers essential information on purchase recommendations, low inventory items, and timing bottlenecks. By showcasing this data, Fulcrum enables manufacturers to make informed decisions for procurement and maintain optimal inventory levels. The system also features a live graph that continually updates supply and demand trends based on outstanding jobs, purchase orders, and other demand factors.
—
Fulcrum provides users with the information they need when they need it, empowering businesses to operate more efficiently and effectively. While downloadable reports are available for in-depth analysis, presenting the most critical information on each page ensures transparent visibility into real-time data at all times.
Transcript:
Hi, I'm Kelsey. In this walkthrough, I'll show you how Fulcrum displays key metrics throughout the system so you can always know what's going on at a glance. Let’s use the navigation bar to head over to sales orders, which acts as a central hub for all of your important key information.
As you can see, we've laid out several key performance indicators at the top of the screen, including things like what has been shipped in the last seven days, anything that's running late, and any statuses that you may need to filter down to in order to perform your tasks. If you click on any of these windows, you'll see that it filters the information below.
Entering directly into a job, we offer live information about what is happening on your shop floor at any given time. This can include things like live labor data, material picking, and your margins based on what was initially estimated for a job. All of this data being live means you don't have to go out and ask somebody about what is going on on your floor – you can see it in real-time.
Now we're going to head over to purchasing planning. I'm going to go ahead and take a look at our fastener that we need to buy. When navigating to purchasing planning, again you'll see some key information up here at the top.
"Purchase recommended" is going to tell you anything that you are either running low on, will need for a job, or has some kind of minimum on hand that needs to be met. Your timing issue is going to display to you if you have something on order, but it may not be here on time to meet the needs of the jobs you currently have outstanding.
If we search for our fastener and click into it, this graph will show you over time what your supply will look like and is continually updating from live data throughout the system. This includes things like outstanding jobs, purchase orders, and any other demand issues that may arise.
Our goal is to give you the information that you need on each page as you need it. This will help you run your business in an efficient and effective way. If you need to dig into the data, downloadable reports are always available, but we find displaying the most important information on each page gives you clear visibility into your live data at any time.
Check out some of our other videos to find what else Fulcrum can do for your shop. Thank you.
This transcript and summary were written with the help of Ai.